Zoom into charts and graphs
There are a couple of ways to view data more clearly on charts and graphs.
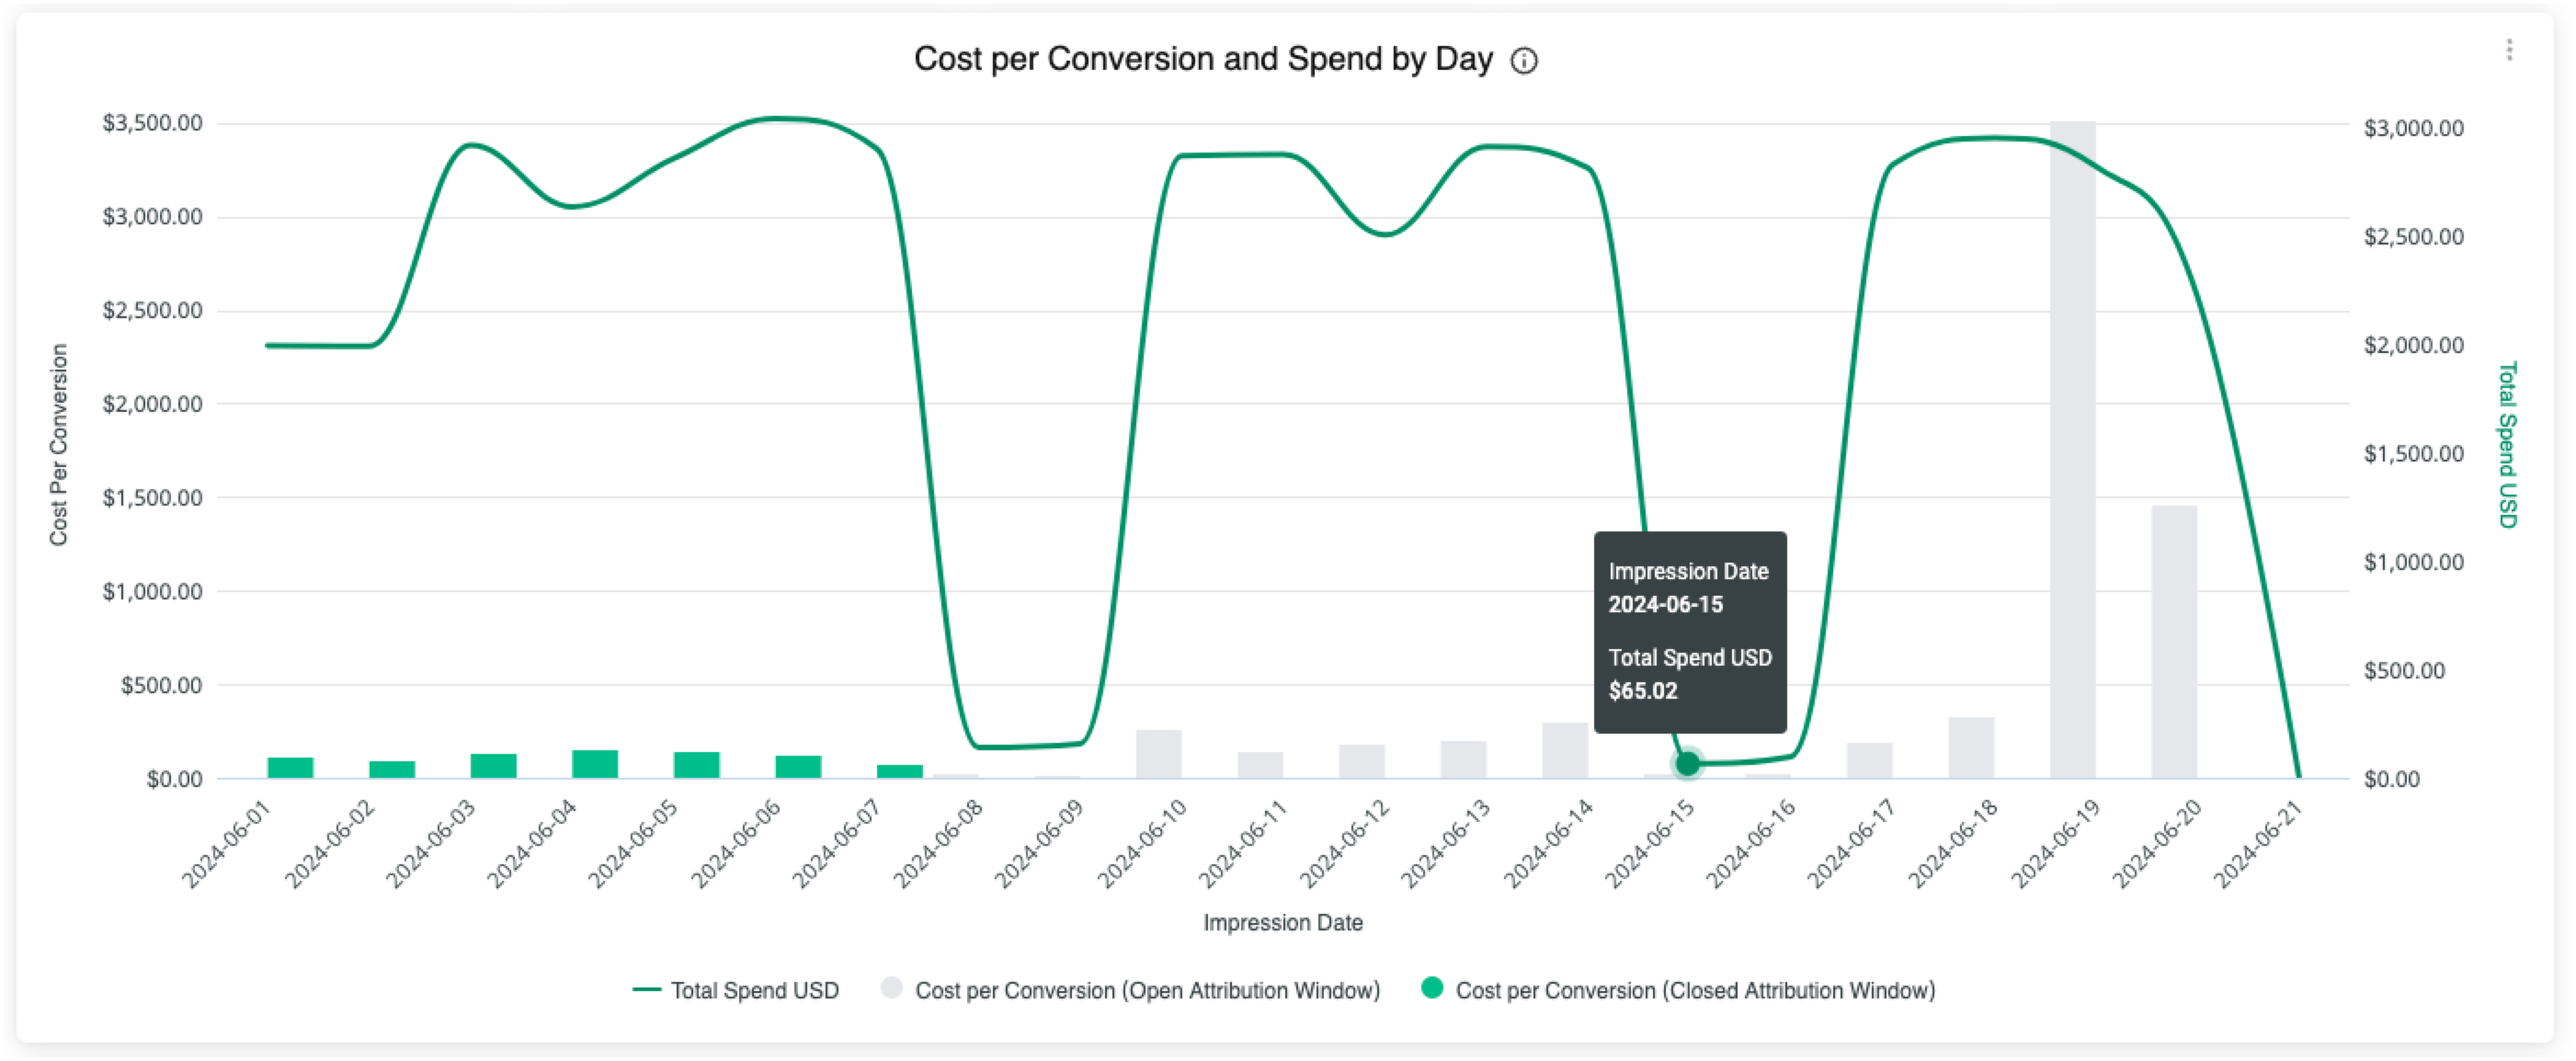
Hover over data points
You can click on any data point in a graph to view details about that data point.
Zoom
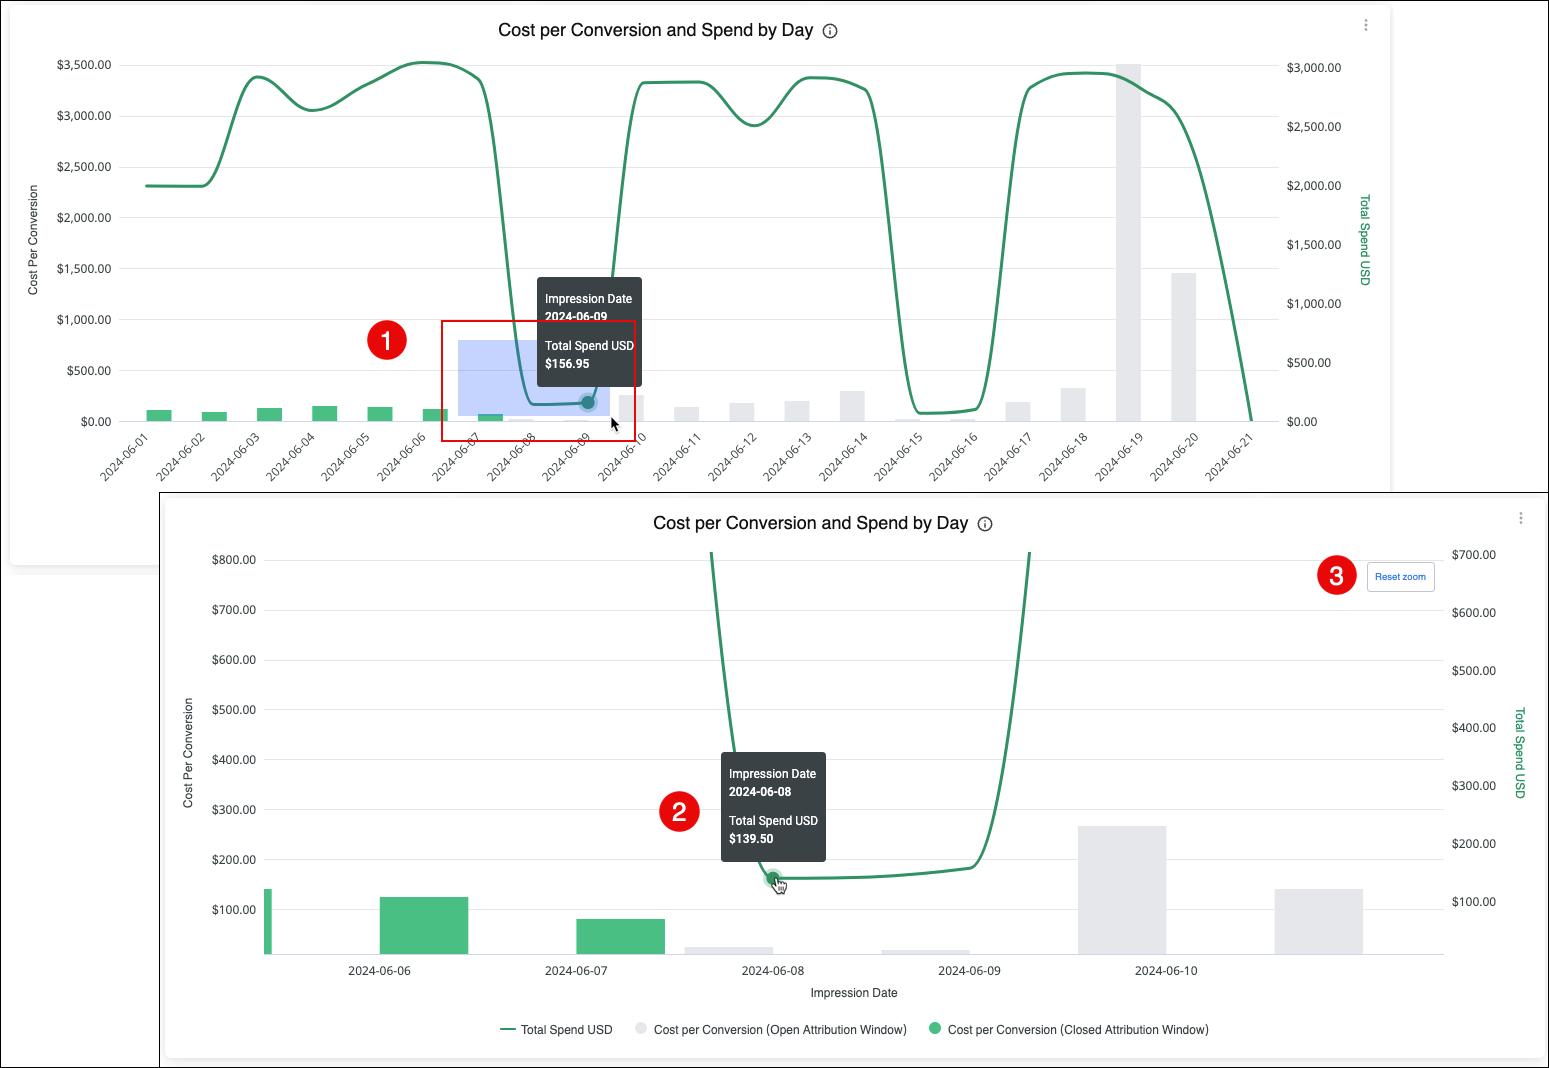
Zoom into any area of a chart or graph that you want to see more clearly.
1️⃣ To zoom, click and drag your mouse over any area of the chart.
2️⃣ The chart zooms into that area of the graph.
3️⃣ Click Reset zoom to return to the default view.