Add a tile to an existing dashboard
ADVANCED TOOLS
Once you've created a dashboard, you can add additional tiles to it at any time. You can add a tile to an existing dashboard in one of two ways:
Add a tile from within the dashboard
Add a tile from an Explore
Add a tile from within a dashboard
To add a tile from within a dashboard, perform the following steps:
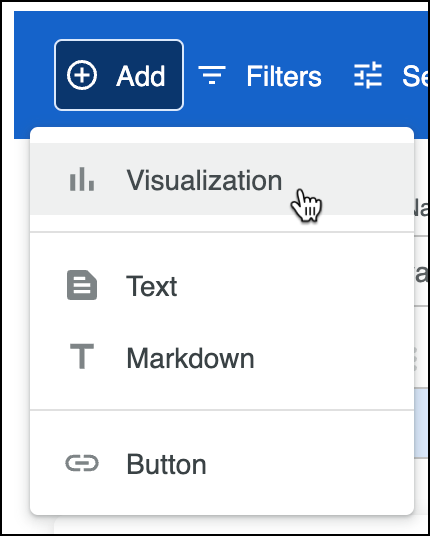
Click Add > Visualization.

The Choose an Explore window appears. Click on an Explore to begin building your query.
The Edit Tile window appears. Replace “Untitled” with the name of your query.
Select the desired fields and filters from the field picker.
Configure your visualization options in the Visualization pane.
Once you have set up your query, click Run.
Click Save.
Add a query tile from an Explore
You can save a query tile to a dashboard directly from an Explore. Once you have a query that you want to add to the dashboard, complete the following steps:
Click
 > Save > To an existing dashboard. The Add to a Dashboard in this existing folder dialog appears.
 In the Title field, name the tile.
From the list of folders, select the dashboard where you want to add this new tile or type a dashboard name in the Filter by title... search box to narrow the results.
Click Save to Dashboard.
A confirmation message appears at the top of the Explore once you have added it as a tile on a dashboard. Click the title of the dashboard in the confirmation message to open the dashboard in Edit mode.
Add a text tile to a dashboard
To add a text tile to your dashboard, perform the following steps:
Click Add > Text.
To format a text tile, highlight the text that you want to format, and click the text style icons at the top of the tile.
As you edit the text, it updates to show you how it will appear once you save it.
Click Save.
When saved, text tiles appear at the bottom of the dashboard. Move and resize the tile as needed.
About markdown tiles
Markdown tiles are dashboard text tiles that can be formatted using HTML and Markdown. Once you select Markdown, a window appears where you can add a title, subtitle, and body. These elements are optional.
Titles and subtitles support some HTML, including links and images. You can also use some HTML in the bodies of Markdown tiles. To understand how Looker renders HTML, see ↗️ Looker documentation > HTML sanitization.
Body text supports a subset of the Markdown markup language. See ↗️ Looker documentation > Using Markdown in Markdown tiles for more information about which Markdown syntax is supported in the body text.
To add a markdown tile, put the dashboard in Edit mode and click Add > Markdown.
When saved, Markdown tiles appear at the bottom of the dashboard. Move and resize the tile as needed.
